Bright Africa: Private Equity Report 2016

Feature Highlight
The median EV/EBITDA of the Nigerian market was up 24% from Dec14, reaching 7.67x at the end of 2015.
Private equity fundraising over time
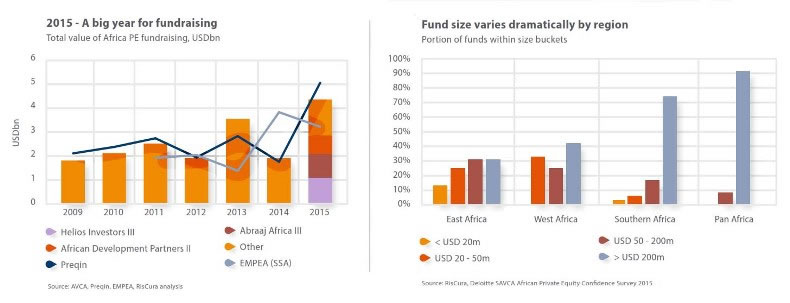
The increase in private equity fundraising in 2015 is evidence of the strong interest in investing in Africa’s real economy, despite the recent turmoil in which many African countries find themselves. In the face of the decline in commodity prices, oil in particular, currencies have come under strain impacting liquidity and trade. The slowdown in the growth of emerging market economies in general, has not inhibited the ability of African investment managers to attract significant amounts of capital for the larger Pan-African funds as well as Sub-Saharan Africa funds. Some of the largest African private equity funds seen to date were closed in 2015, including Helios Investors Fund III ($1.1bn), Abraaj Africa Fund III ($990m) and African Development Partners Fund II ($725m).
Investors making commitments to Africa may be flocking to these experienced managers as a way of mitigating their risk, knowing that the next few years are bound to be a more difficult time for the continent. It is clear from the oscillation in capital raised over recent years that the industry goes through phases of fundraising, investment and exits; and it is expected that 2016 will show lower values of capital raised after the strong activity in 2015.
It is also worth noting that the adjacent column graph below allocates capital raised in the year of the fund’s final close (Source: AVCA Private Equity Data Tracker). There are other sources that show a slightly different picture as they allocate capital raised to the year in which the funds reached first, second and final close respectively (EMPEA and Preqin). The major difference in the EMPEA data is that the Helios Investors Fund III was recorded at first close, which occurred in 2014.
The size of African funds is quite varied depending on the regional focus of the fund. In regions where private equity is less developed, such as East and West Africa, the size of transaction opportunities is generally smaller, and capital is raised with this in mind. In these regions, it is quite common to find fund sizes of less than $50m, and only approximately 30% of funds in East Africa and 40% in West Africa are greater than $200m. In Southern Africa (including South Africa), 74% of funds are greater than $200m as the market is more developed and companies are therefore larger and can handle larger transactions. In Pan-African funds, it is not feasible to raise a fund of less than $50m in size, as the cost of executing a fund with continent-wide expertise and presence is much greater. Almost all Pan-African funds have commitments of greater than $200m, meaning that Pan-African funds are chasing much larger transaction sizes than regional funds.
PE geographic focus
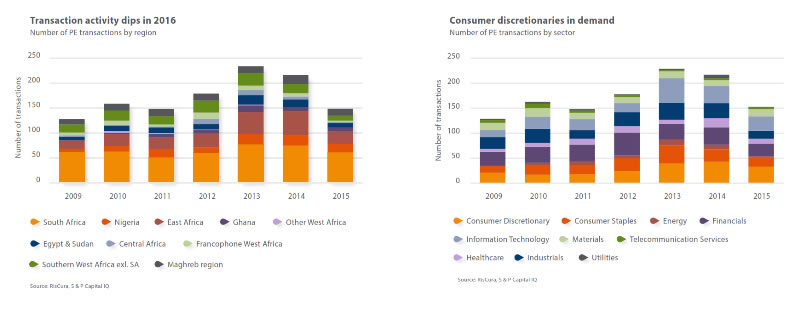
The dip in transaction activity in 2015 is not surprising, considering the macroeconomic uncertainty experienced in many key markets during the year. The unknown impact of declining oil revenues, currency exchange controls, elections and the like, has caused a ‘wait-and-see’ lull in activity.
This has been seen across all regions, with total investments dipping to levels last seen in 2010 and 2011. On the other hand, M&A activity on the continent appears to have trended upward in 2015 with over 1200 transactions reported, an increase from 990 the previous year (Source: S&P Capital IQ).
South African transactions made up approximately 40% of the total in 2015, up from 34% the previous year. Nigeria increased from 10% in 2014 to 11% in the 2015, while East Africa declined from its high of 24% in 2014 down to 21%.
PE sector focus
Although there has been a downward trend in activity over the past year, the consumer discretionary sector has continued to attract interest from investors, making up 22% of all transactions in 2015. Of particular interest over the past few years has been online retail, education services such as tertiary education and colleges, as well as advertising and publishing houses.
The financials sector remains a large portion of transaction activity in 2015, making up 16% of total transactions. Points of interest range from regional banking to asset management and financial services across all regions.
And finally, information technology remains popular on the continent, primarily in the internet software and services industries.
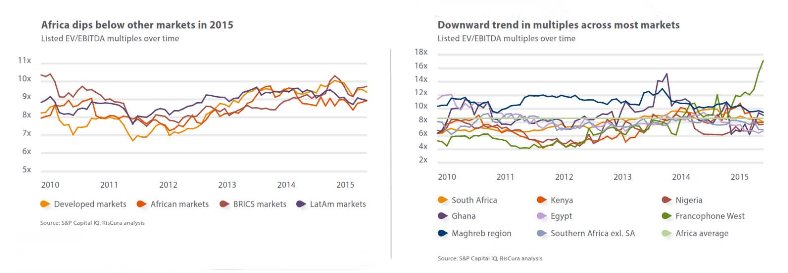
Listed EV/EBITDA multiples
Following the volatility of multiples post the financial crisis, the developed, African and BRICS markets’ multiples appear to be moving much more closely in line with one another.
Valuations of African markets have dipped marginally below the other markets through 2015 as a result of negative sentiment to emerging markets globally.
African markets have tracked LatAm markets more closely over the past two years as emerging markets have begun to slow, and developed market capital has flowed to safe havens.
Egypt’s stock exchange was one of the worst performers in 2015, declining from an average EV/EBITDA of 8.94x at Dec14 to 6.71x at Dec15. Nigeria’s exchange has begun to recover from the decline in the last quarter of 2014 when uncertainty over elections and a sharp fall in the oil price diminished investor confidence in Africa’s largest economy. The median EV/EBITDA of the Nigerian market was up 24% from Dec14, reaching 7.67x at the end of 2015.
Both South Africa and Southern Africa excluding South Africa have trended downward in 2015, by 19% and 14% respectively, on the back of lower growth expectations for the region.
Francophone West Africa (the BRVM) has been an interesting case in 2015. This is a small sample of stocks, most of which are based in Côte d’Ivoire. There seems to have been a significant increase in share prices that is not equally supported by earnings growth. The exchange has increased in value by 87%, from a 9.11x multiple in Dec14 to 17.09x in Dec15. Because this exchange is within the West African Monetary zone, it is traded in CFA franc, a currency used in West and Central Africa, which is pegged to the Euro. One reason for this boost in the BRVM’s performance could be that the use of the CFA franc has made the exchange a haven from the currency volatility plaguing other markets. Overall, Africa’s major markets finished 2015 trading in the range of 7-10x EV/EBITDA.
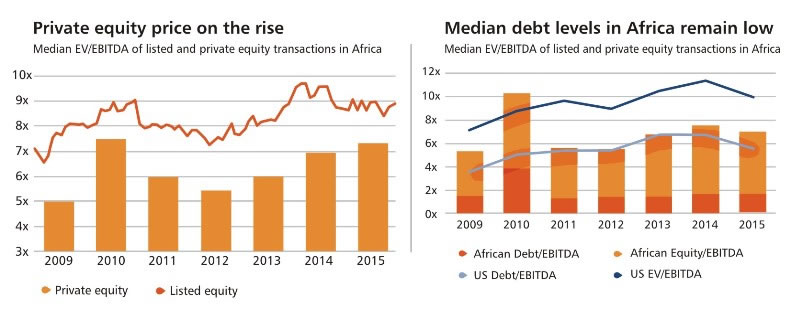
Private equity multiples in Africa: Over time
The last four years have seen an increase in private equity market multiples on the continent. Over the 2009 to 2013 period, more than half of PE transactions took place at lower than a 6x multiple. In 2014 and 2015 however, less than a third of PE transactions took place at that level.
Over 30% of reported PE transactions in 2014 and 2015 took place at greater than a 10x multiple, while this was less than 20% of cases in the earlier periods.
In contrast, the EV/EBITDA multiples of listed equity on the continent have remained relatively flat over the 2013 – 2015 period, with a slight decline from 2014 levels.
Of the transactions with reported Enterprise Value, just over half of companies entered by PE funds in the 2009 to 2015 period reflected a Net Debt position on their balance sheets. The average Debt/EBITDA position of these companies was 1.82x over the period, which drops down to 1.65x if 2010 is excluded.
2015 is an exception to the norm, as the value of all PE transactions trended upwards, those with debt declined marginally. These fluctuations do appear from time to time and for a number of different reasons.
The stable level of debt indicates that the private equity industry in Africa is still not debt driven, and the majority of fluctuation in multiples relates to the availability and willingness of investors to put equity on the table.
This is quite a stark contrast to the situation in the United States, where the equity gap has remained within a range of 3.6x to 4.6x over the entire period.
The multiples paid for PE transactions in the US market are therefore much more highly debt driven, and fluctuate with the availability of debt in the market.
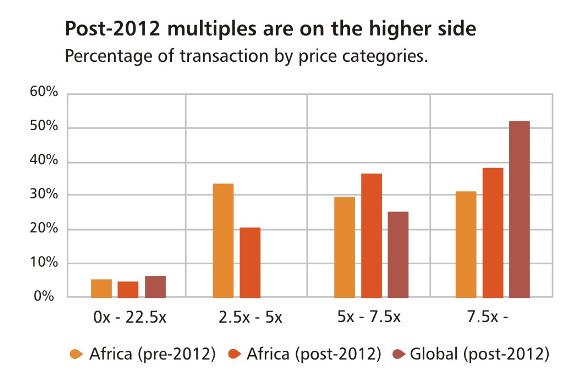
By price range
In Africa before 2012, 34% of transactions were taking place in the 2.5x - 5x bracket. The period post-2012 paints a bit of a different picture, with a
combined 75% of transactions taking place above 5x.
Compared to the US however, the number of transactions occurring in the 7.5x plus category are still substantially lower, with more transactions sitting in the 5x – 7.5x bracket.
The reasons for these higher multiples could be attributed to a number of
factors. One of the common reasons for a multiple greater than 7.5x is high growth expectations, particularly where this growth is expected in the short term. In addition to this, perceived risk on the continent may have declined, as investors become more comfortable with the environment leading to a reduction in discounts for risk adjustments.
Another factor is that increased competition in the market on the back of higher fundraising is forcing investors to bid higher to secure deals, resulting in more highly priced entry multiples.
By size
Higher priced transactions tend to take place at the larger end of the spectrum, in this case in the category of companies with Enterprise Value greater than USD 250m.
It is interesting to note that at an Enterprise Value of less than USD 250m, there is very little differentiation between the multiples of medium sized transactions and small transactions. The median multiple within both size buckets is around 6x. However, on the upper end of the spectrum, the very large transactions are attracting EV/EBITDA multiples of over 8x.
Using a median Debt:Equity level across those investee companies that do have debt on their balance sheets, the debt level in these companies remains quite flat and low, especially in contrast to those in a global context, regardless of the size of the company.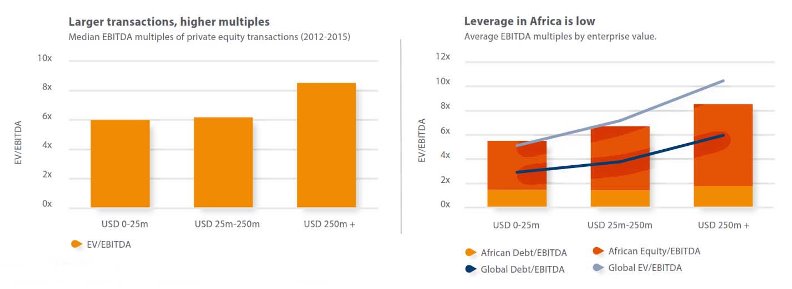
By sector
Both the consumer discretionary and consumer staples industries fetch the highest multiples across all sectors. The consumer sector has been identified time and time again as one of the most attractive areas for investment on the continent, due to the favourable demographics and the so-called ‘growing middle class’. It is clear that there are many transactions taking place in this sector, within consumer discretionary in particular. High growth expectations, fierce competition, or decreased risk perception could be the contributors to these relatively higher multiples.
Another prevalent sector is the industrials sector, which incorporates construction, engineering, transport, logistics, equipment and machinery, among others.
These industries are essential to any economy and will benefit greatly from a growing economy, which explains their popularity among African countries. On the other end, the energy sector attracts far fewer and much larger transactions at a lower cost. The highly regulated nature of this industry could be a factor keeping prices lower, as well as the significant amount of capital required.
It is interesting to note however, as has been discussed in previous Bright Africa reports, that the range of multiples across these sectors is small, from 4.66x (energy) to 6.90x (consumer staples).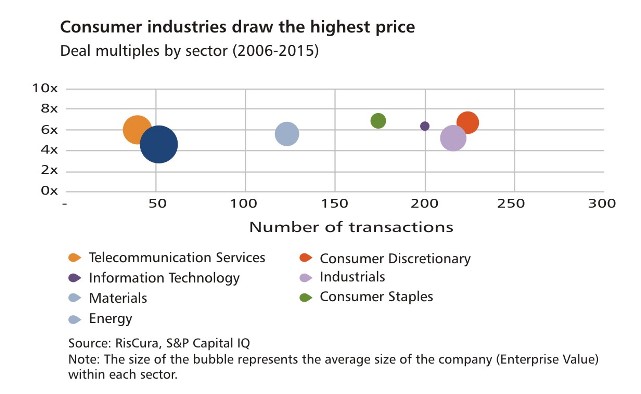
About RisCura
RisCura is a global, independent provider of professional investment services. The firm services institutional investors, asset managers, hedge funds and private equity firms with over USD200 billion in assets under advice. Bright Africa is RisCura’s on-going research endeavour, providing insight into the drivers, enablers and managers of investment
on the continent.
Other Features
-
At 50, Olajide Olutuyi vows to intensify focus on social impact
Like Canadian Frank Stronach utilised his Canadian nationality to leverage opportunities in his home country of ...
-
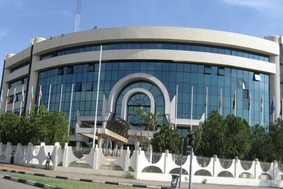
Reflection on ECOWAS Parliament, expectations for the 6th Legislature
The 6th ECOWAS Legislature must sustain the initiated dialogue and sensitisation effort for the Direct Universal ...
-
The $3bn private credit opportunity in Africa
In 2021/2022, domestic credit to the private sector as a percentage of GDP stood at less than 36% in sub-Saharan ...
-
Tinubunomics: Is the tail wagging the dog?
Why long-term vision should drive policy actions in the short term to achieve a sustainable Nigerian economic ...
-
Living in fear and want
Nigerians are being battered by security and economic headwinds. What can be done about it?
-
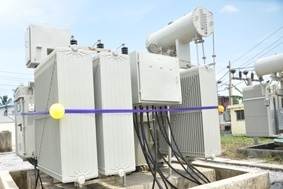
Analysis of the key provisions of the NERC Multi-Year Tariff Order ...
With the MYTO 2024, we can infer that the Nigerian Electricity Supply Industry is at a turning point with the ...
-
Volcanic explosion of an uncommon agenda for development
Olisa Agbakoba advises the 10th National Assembly on how it can deliver on a transformative legislative agenda for ...
-
Nigeria and the world in 2024
Will it get better or worse for the world that has settled for crises?
-
The Movers and Shakers of Nigeria 2023
This special publication profiles 25 people and institutions based on their societal or industry impact in 2023.


Most Popular News
- IFC, partners back Indorama in Nigeria with $1.25 billion for fertiliser export
- Ali Pate to deliver keynote speech at NDFF 2024 Conference
- Univercells signs MoU with FG on biopharmaceutical development in Nigeria
- CBN increases capital requirements of banks, gives 24 months for compliance
- CBN settles backlog of foreign exchange obligations
- Nasdaq Dubai welcomes $600m sukuk listing by Islamic Development Bank